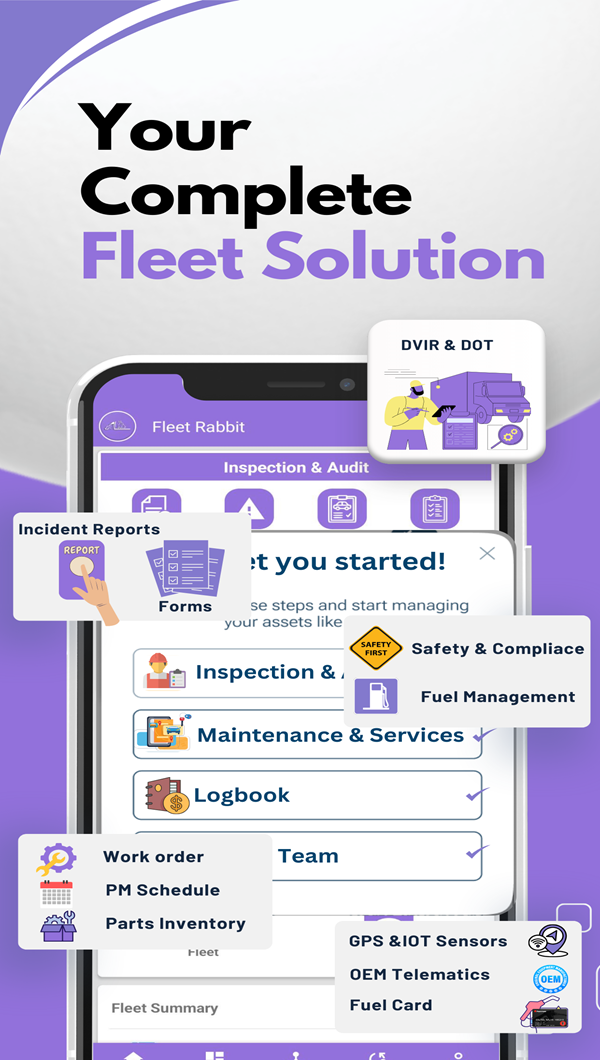
Fleet Data Analytics Platform for Accurate Reporting
Transform fleet data into actionable insights with comprehensive dashboards, customizable reports, and one-click Excel exports across inspections, maintenance, and fuel management.

View live KPIs across inspection, maintenance, and fuel modules
Today, 7/30/90 days, or custom date ranges with multiple views
One-click Excel export for all reports with complete data
Inspection dashboard with comprehensive analytics
Monitor inspection performance with real-time dashboards showing total inspections, good versus faulty classifications, corrective action status, and linked work order generation with multiple view options.
- Track good and faulty inspections
- Corrective action status monitoring
- Multiple dashboard views available
- Custom date range filtering

Maintenance KPI
Access comprehensive maintenance metrics including parts and labor costs, mean time to repair (MTTR), unplanned work order percentage, overdue work order tracking, and planned versus unplanned analysis with multiple dashboard views.
- Track parts and labor costs
- Monitor mean time to repair (MTTR)
- Unplanned work order percentage
- Overdue work order tracking
Maintenance Dashboard
0 Hours
100.00%
Dashboard Views
Fuel management dashboard
Comprehensive fuel tracking with total fuel logs, quantity monitoring, cost analysis, outstation tracking, average fuel quantity per day, and date-wise fuel consumption with multiple view options for fleet-wide fuel management.
- Total fuel logs tracking
- Fuel quantity and cost monitoring
- Outstation quantity tracking
Fuel Dashboard
3,542
45,280
8,450
Dashboard Views
Comprehensive Excel reports
Generate detailed Excel exports for all modules with customizable date ranges. Export inspection reports, incident reports, work orders, fuel logs, fuel bunker history, parts consumption reports, and fleet reports with complete data for analysis.
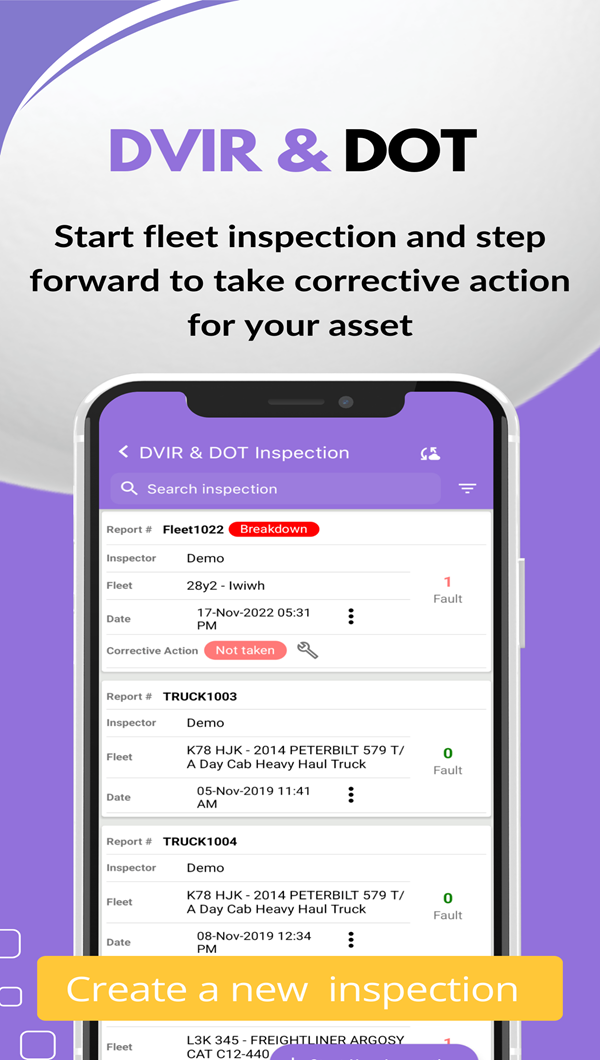
- Inspection and incident reports
- Work order and DVIR reports
- Fuel logs and bunker history
Excel Report Center
Available Reports
Date Range Options
Visual analytics & charts
Interactive charts and graphs including inspection conducted by month, good versus faulty inspections, action versus no action taken, top running fleets, top fuel consumption fleets, and comprehensive trend analysis for informed decision making.
- Monthly inspection trends
- Good vs faulty analysis
- Fleet performance ranking
- Fuel consumption comparison
Analytics & Charts
Inspection Trends
Action Status
Top Running Fleets
Powerful Analytics & Reporting Tools
Everything you need to track performance, generate reports, and make data-driven decisions
Real-time dashboards
Live KPI metrics across inspection, maintenance, and fuel modules with instant updates.
Date range filters
Today, Last 7/30/90 Days, or custom date ranges for precise reporting periods.
Excel export
One-click export for all reports with complete data and custom date ranges.
Multiple views
Overview, datewise, by inspector, by fleet, category, and checklist views available.
Inspection analytics
Track total, good, and faulty inspections with corrective action status.
Maintenance KPIs
Parts cost, labor cost, MTTR, unplanned workorders, and overdue tracking.
Fuel management
Total logs, quantity, costs, outstation tracking, and consumption analysis.
Visual charts
Interactive graphs showing trends, comparisons, and fleet performance rankings.
Corrective actions
Track action taken, partially taken, not taken, and N/A status for inspections.
Linked workorders
Track total linked workorders generated from inspection defects.
Fleet ranking
View top running fleets and fuel consumption leaders with meter readings.
MTTR tracking
Monitor mean time to repair with hourly precision for efficiency analysis.
Real Results from Data-Driven Decisions
Regional Transport Cuts Costs 40% with Fleet Analytics
40%
Cost Reduction
In maintenance expenses75%
Time Saved
On report generation95%
DOT Compliance
Inspection pass rate"FleetRabbit's analytics dashboard transformed how we manage our fleet. The real-time KPI tracking helped us identify maintenance trends and reduce unplanned downtime by half. Excel exports save our team hours every week on compliance reporting."
Michael Chen, Fleet Manager, Regional Transport Solutions
Before vs. After
Rate
Rate
"The maintenance KPI dashboard shows exactly where we stand. MTTR tracking helped us identify process bottlenecks and improve repair efficiency by 35%."
Sarah Johnson
Maintenance Director
"Excel exports make audit preparation effortless. We generate comprehensive inspection reports in seconds instead of spending days compiling data manually."
Tom Rodriguez
Safety & Compliance Manager
"Fuel management analytics revealed consumption patterns we never knew existed. We identified inefficient routes and reduced fuel costs by 18% in the first quarter."
Lisa Park
Operations Manager
Analytics & Reporting FAQ
FleetRabbit provides three main KPI dashboards: Inspection Dashboard (with Overview, Datewise, Inspection Classification, By Inspector, By Fleet, Fleet Category, and By Checklist views), Maintenance Dashboard (with Overview, Team, Analytics, Status & Priority, Workorder Type, Fleet & Schedule views), and Fuel Dashboard (with Overview, Fleet, and Fleet Category views). Each dashboard includes customizable date ranges (Today, Last 7/30/90 Days, or Custom Date) and real-time data updates.
You can export seven comprehensive Excel reports: Inspection Reports (complete DVIR and inspection data), Incident Reports (all incidents with details), Work Order Reports (maintenance history and costs), Fuel Log Reports (all fuel transactions), Fuel Bunker History (fuel storage and distribution), Parts Consumption Reports (parts usage tracking), and Fleet Reports (overall fleet performance). All exports include complete data fields and can be filtered by custom date ranges before exporting.
The Maintenance Dashboard tracks six key performance indicators: Parts Cost (total parts spending), Labor Cost (technician time and rates), Total Cost (combined parts and labor), Mean Time To Repair or MTTR (average repair duration in hours), Unplanned Workorder Percentage (reactive vs. preventive maintenance ratio), and Overdue Workorder Average (tracking delayed maintenance). The dashboard also includes Planned vs. Unplanned Workorder visualization and Total Parts count for inventory oversight.
The Inspection Dashboard includes a Corrective Action Status chart that categorizes inspection defects into four statuses: Taken (corrective actions completed), Partially (actions in progress), Not Taken (actions pending), and N/A (no action required). The dashboard also tracks Total Linked Workorders showing how many work orders were automatically generated from inspection defects. This creates a complete audit trail from defect identification through resolution.
The Fuel Dashboard monitors six comprehensive metrics: Total Fuel Logs (number of fuel transactions), Total Fuel Quantity (gallons or liters consumed), Total Outstation Quantity (fuel purchased away from base), Average Fuel Quantity Per Day (daily consumption rate), Total Fuel Cost (complete fuel spending), and Total Outstation Cost (away-from-base fuel expenses). The dashboard includes Date Wise Fuel Quantity charts and can display data by Overview, Fleet, or Fleet Category views.
FleetRabbit provides multiple interactive visualizations: Inspection Conducted by Month (bar chart showing monthly inspection volumes), Good vs Faulty Inspection (line chart comparing pass/fail rates), Action vs No Action Taken (bar chart showing corrective action completion), Top Running Fleets (bar chart ranking vehicles by meter readings), Top Fuel Consumption Fleets (ranking by fuel usage), and Date Wise Fuel Quantity (consumption trends). All charts update dynamically based on selected date ranges and can be exported with reports.
Yes, both the Inspection and Maintenance dashboards include specialized views for tracking individual and team performance. The Inspection Dashboard has "By Inspector" view showing performance metrics for each inspector, while the Maintenance Dashboard includes a "Team" view for tracking workorder completion by maintenance teams. You can also filter by Fleet, Fleet Category, or Checklist type to analyze performance across different equipment types or inspection procedures. All views support custom date range filtering.
Every dashboard and report includes flexible date filtering with four quick options (Today, Last 7 Days, Last 30 Days, Last 90 Days) and a Custom Date option that opens a date picker allowing you to select any start and end date. Once you select a date range, all dashboard KPIs, charts, and metrics update instantly to reflect only data from that period. The same date range is applied when you export reports to Excel, ensuring your exports match exactly what you see on screen.
Start making data-driven decisions today!
Transform your fleet data into actionable insights with comprehensive analytics and one-click reporting.